


Java Tutorials'a Hoş Geldiniz
Java programlama dilini öğrenmek için kapsamlı eğitimler ve kaynaklar.
İçerikler yakında eklenecek...
⊙ Java Tutorial 158 - ⊙ Java Tutorial
Key Concepts & Highlights
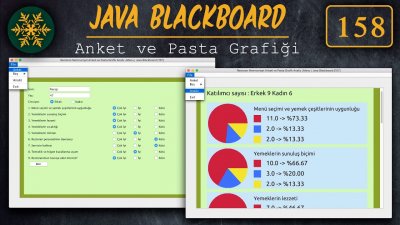
◉ Integrated survey system
◉ Scrollable dashboard displaying
◉ Real-time data processing
◉ Color-coded pie charts showing
◉ Professional analytics interface
Java Tutorials... | Java | Advanced Survey Analytics with Pie Chart
Java Tutorial Files: 158
Java Tutorial | Files: *.java and *.zip and images
⊙ Java Tutorial 158 | Comments

JAVA.000.000.063
Pigeon [pigeon]
rly loved how the pie charts scroll automatically, looks so professional!! the explanation at 05:40 about customizing the survey was super helpfull for my own project. thnx for showing how to handle these datasets in swing, rly good job!!

JAVA.000.000.003
Pilav Tepe [pilavtepe]
Ole!... these pie charts look so clean!! rly loved how u handled the scrolling for multiple questions, i was struggling w that for my data project lol. such a solid tut for visualization man. thnx for sharing!! :) 04:00 Important part.... Don't choose analyse at first. Firstly fill in the survey...

JAVA.000.000.018
Patella [patella]
this tutorial is gold for anyone into data visualization. clean layout, smart use of scroll panels, and detailed calculations. learned a lot, esp how to keep gui organized with many charts.

JAVA.000.000.016
Island gkc [island]
i didnt expect to understand this much lol. pie charts per question + summaries are explained really well. perfect example for real data analysis apps, not just toy projects.

JAVA.000.000.053
Fibula [fibula]
advanced but not confusing, which is rare. the way you handle large datasets and color categories makes everything readable. took notes esp for panel creation and automatic scrolling 👍

JAVA.000.000.017
Atlantis [atlantis]
finally a java gui tutorial that feels professional. loved how each question has its own chart and stats. scrolling with many charts is super useful, i always struggled with that part tbh.

JAVA.000.000.001
Zeynep Kılıçtaş [gerbera]
this is actually insane level 😭 dynamic panels + scroll + pie charts all together?? explanations were clear even for complex parts. helped me understand data viz in java much better, esp percentage logic and layout stuff.

JAVA.000.000.932
Tunçalp Baldan [tuncalpbaldan]
Realy solid java tutorial. The way you build dynamic panels w/ scroll and per-question pie charts is super clean. Definitly helps understanding large datasets, percentages and layout. thx for sharing!

JAVA.000.000.011
Mars Line [mars]
yooo these pie charts look so clean!! rly loved how u handled the scrolling for multiple questions, i was struggling w that for my data project lol. 01:23 code analysis part is rly well explained, loved it. thnx for the solid tut!! :)

JAVA.000.000.015
Ceviz [ceviz]
yooo these pie charts look so clean!! rly loved how u handled the scrolling for multiple questions, i was struggling w that for my data project lol. percentage calc logic is rly solid too. def one of the best gui tuts out there thnx!! :)

JAVA.000.001.001
Floraxense [floraxense]
Im a taxi driver 45 😅 learning Java at nights. This one was hard but very clear anlatım. Pie charts and scroll panels finally make sense to me. Slow slow learning but enjoying it 👍 thanks for this tutorial.

JAVA.000.000.008
Web User [user]
Watching this after school hours 😄 not my main job but Java is my hobby. Pie charts and scrolling panels explained very clean, even for someone not full time dev. Really enjoyed the logic part, thanks for sharing 👍

JAVA.000.000.032
Styx Pluto [styx]
This tutorial was crazy good for me 😅 pie chart logic finally make sense. Scrolling panels + dynamic layout was something i really needed at work. Still junior but learned a lot here, thanks man 👊

JAVA.000.000.005
Camilla Iceberg [iceberg]
This one is really next level 👍 pie charts per question is very smart idea. Scroll panel part was perfect, finally clean data view. Percentage calc explained very well too. Heavy topic but anlatım akıcı, learned alot from this 🙌

JAVA.000.000.006
Arcanus Board [board]
Really solid and detailed work here, I like how each question gets its own pie chart and the scrolling makes it very usable. Percentage math and colors are handled clean, great example of advanced Swing data visualization.